Audience & Inventory Discovery Tool
This guide walks you through how to use the Audience & Inventory Discovery Tool in the POKKT DSP. The tool is designed to help users analyse available audience segments and understand inventory supply
What is the Audience & Inventory Discovery Tool?
The Audience & Inventory Discovery Tool is a sales planning and analytics tool that brings together audience data and inventory data into a unified view.
It enables users to:
-
Identify high-value audience segments
-
Forecast potential campaign reach
-
Export structured data for proposals and client presentations
By eliminating manual data collection and back-and-forth with supply teams, the tool helps improve sales efficiency, win rates, and revenue outcomes.
Why Use the Audience & Inventory Discovery Tool?
-
Centralised view of audience reach and inventory supply
-
Faster and more accurate deal sizing and forecasting
-
Data-backed sales pitches
-
Easy export for client decks and internal planning
-
Reduced dependency on manual data pulls
How to Use the Audience & Inventory Discovery Tool: Step-by-Step Guide
Step 1: Navigate to the Tool
-
Log in to POKKT DSP
-
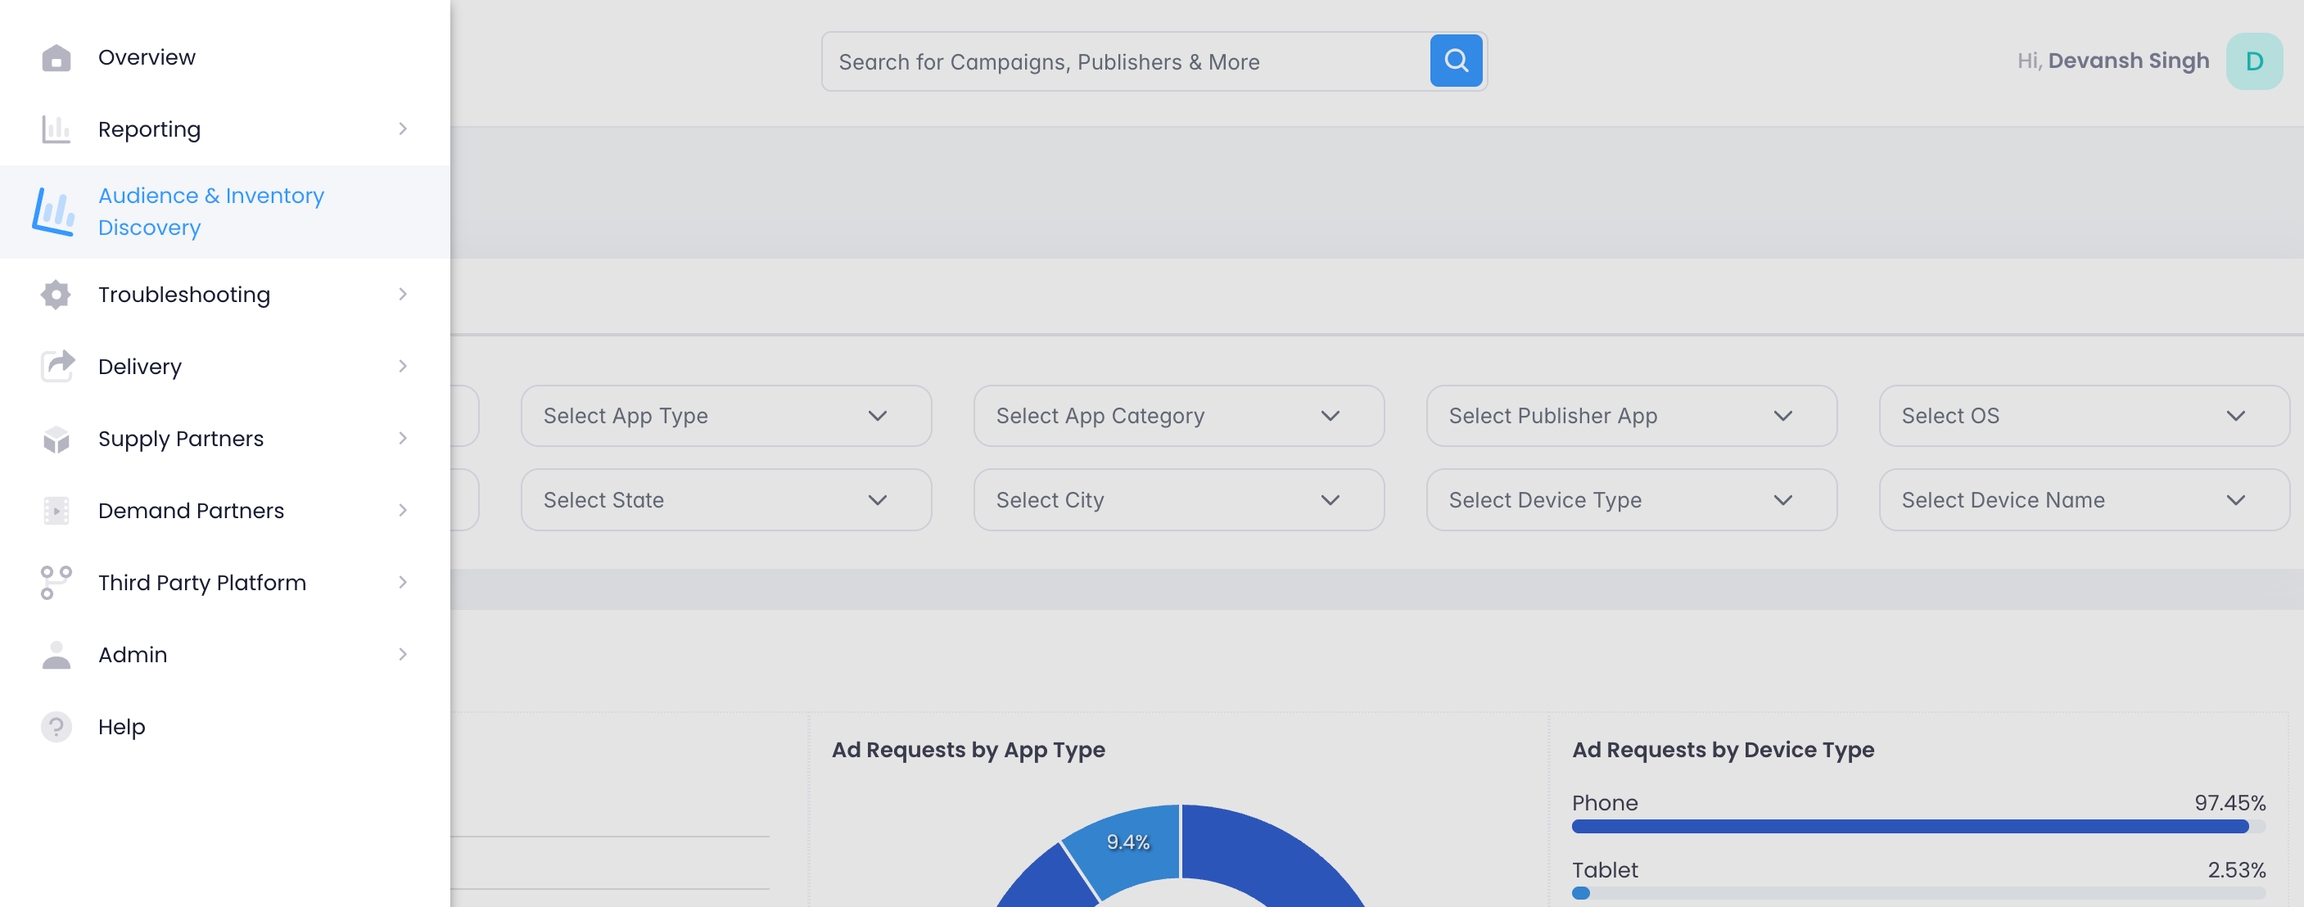
From the left-hand navigation menu, click on Audience & Inventory Discovery
The dashboard loads with default data and available filters.
Step 2: Apply Filters
-
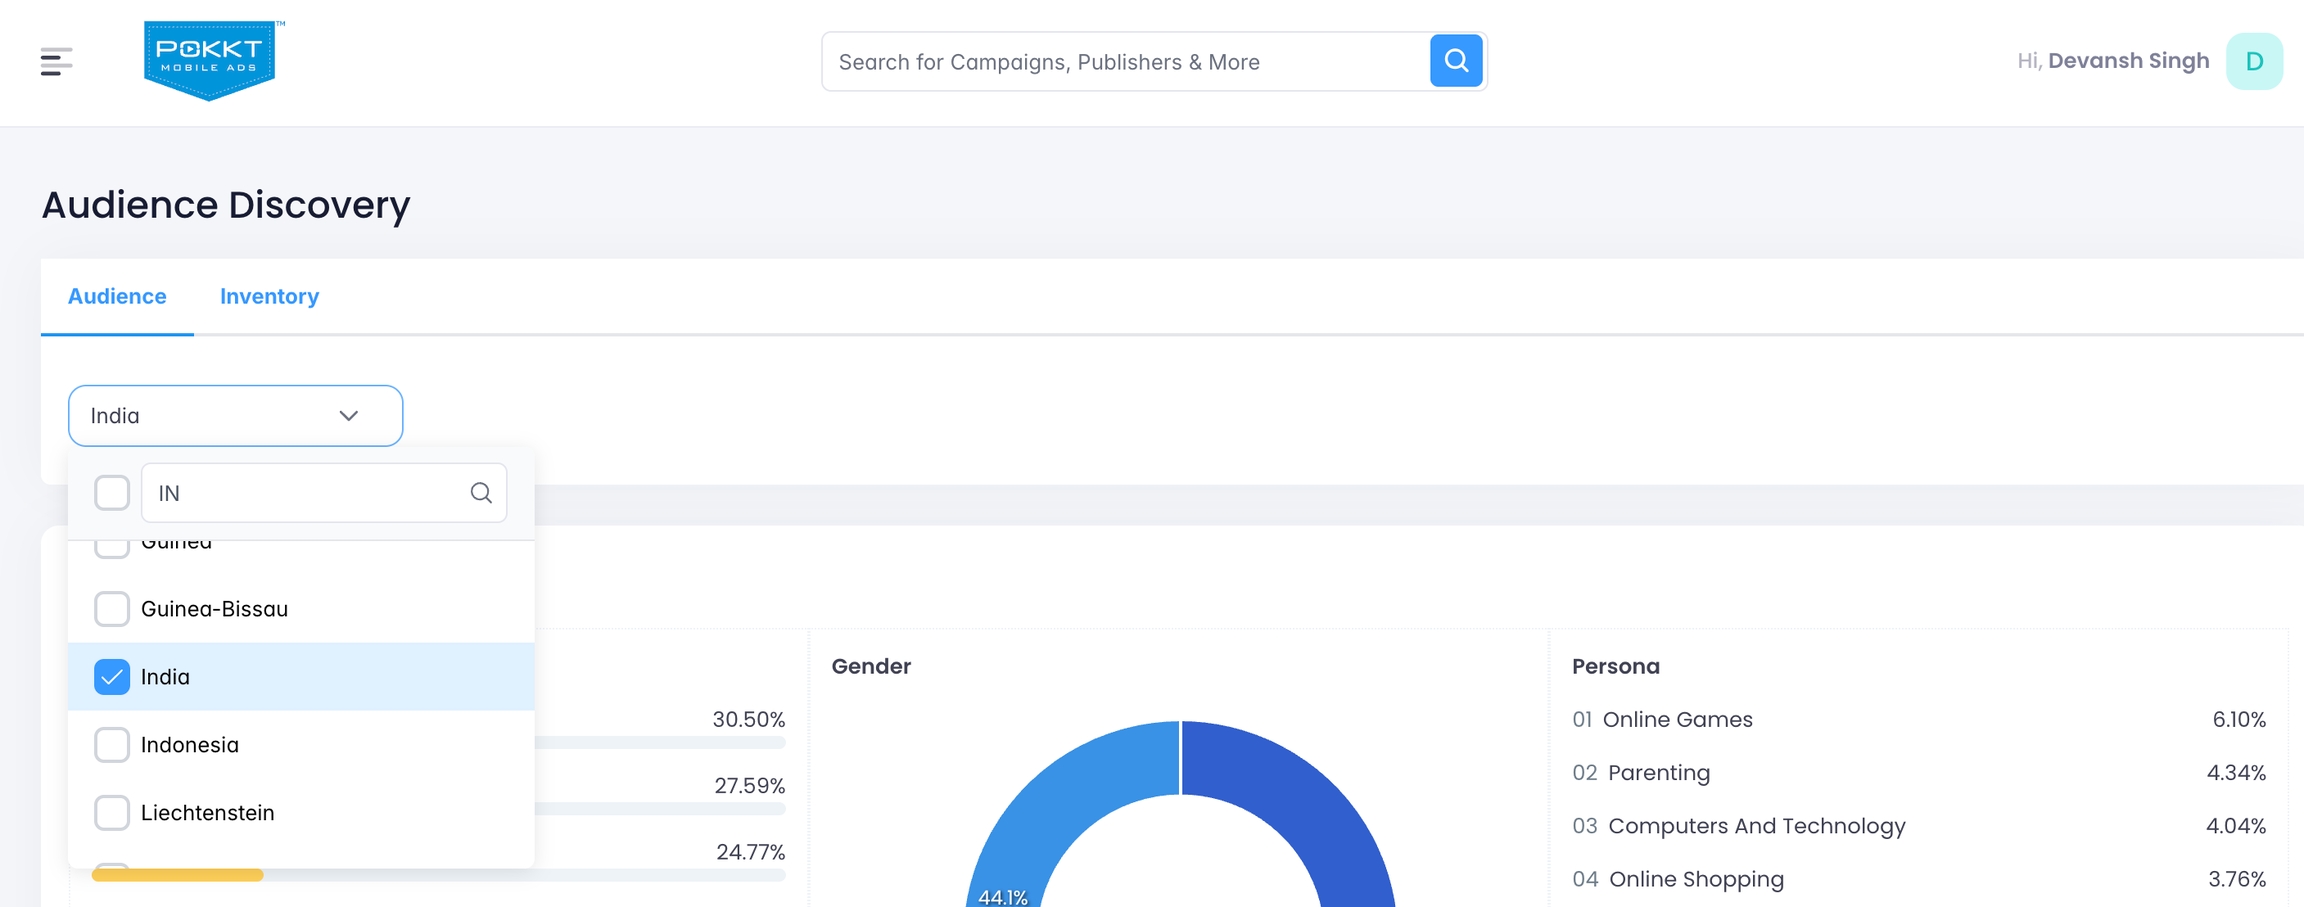
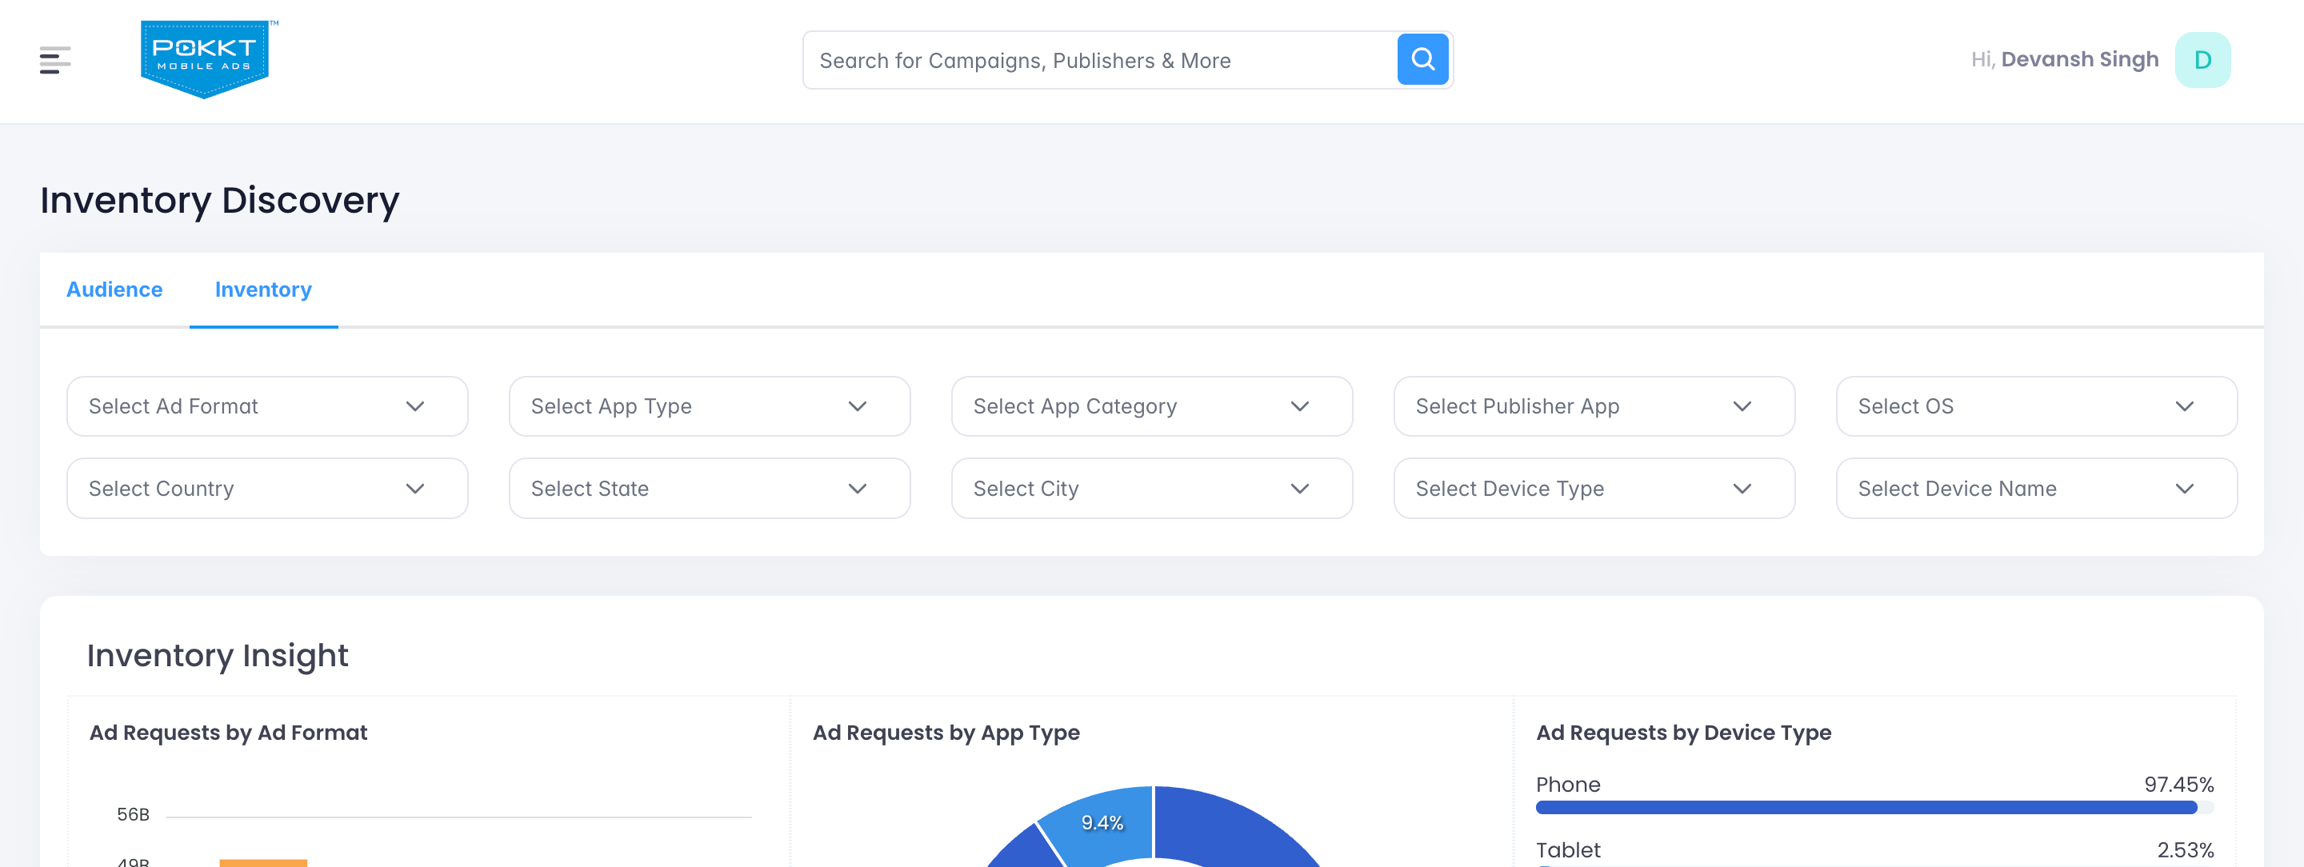
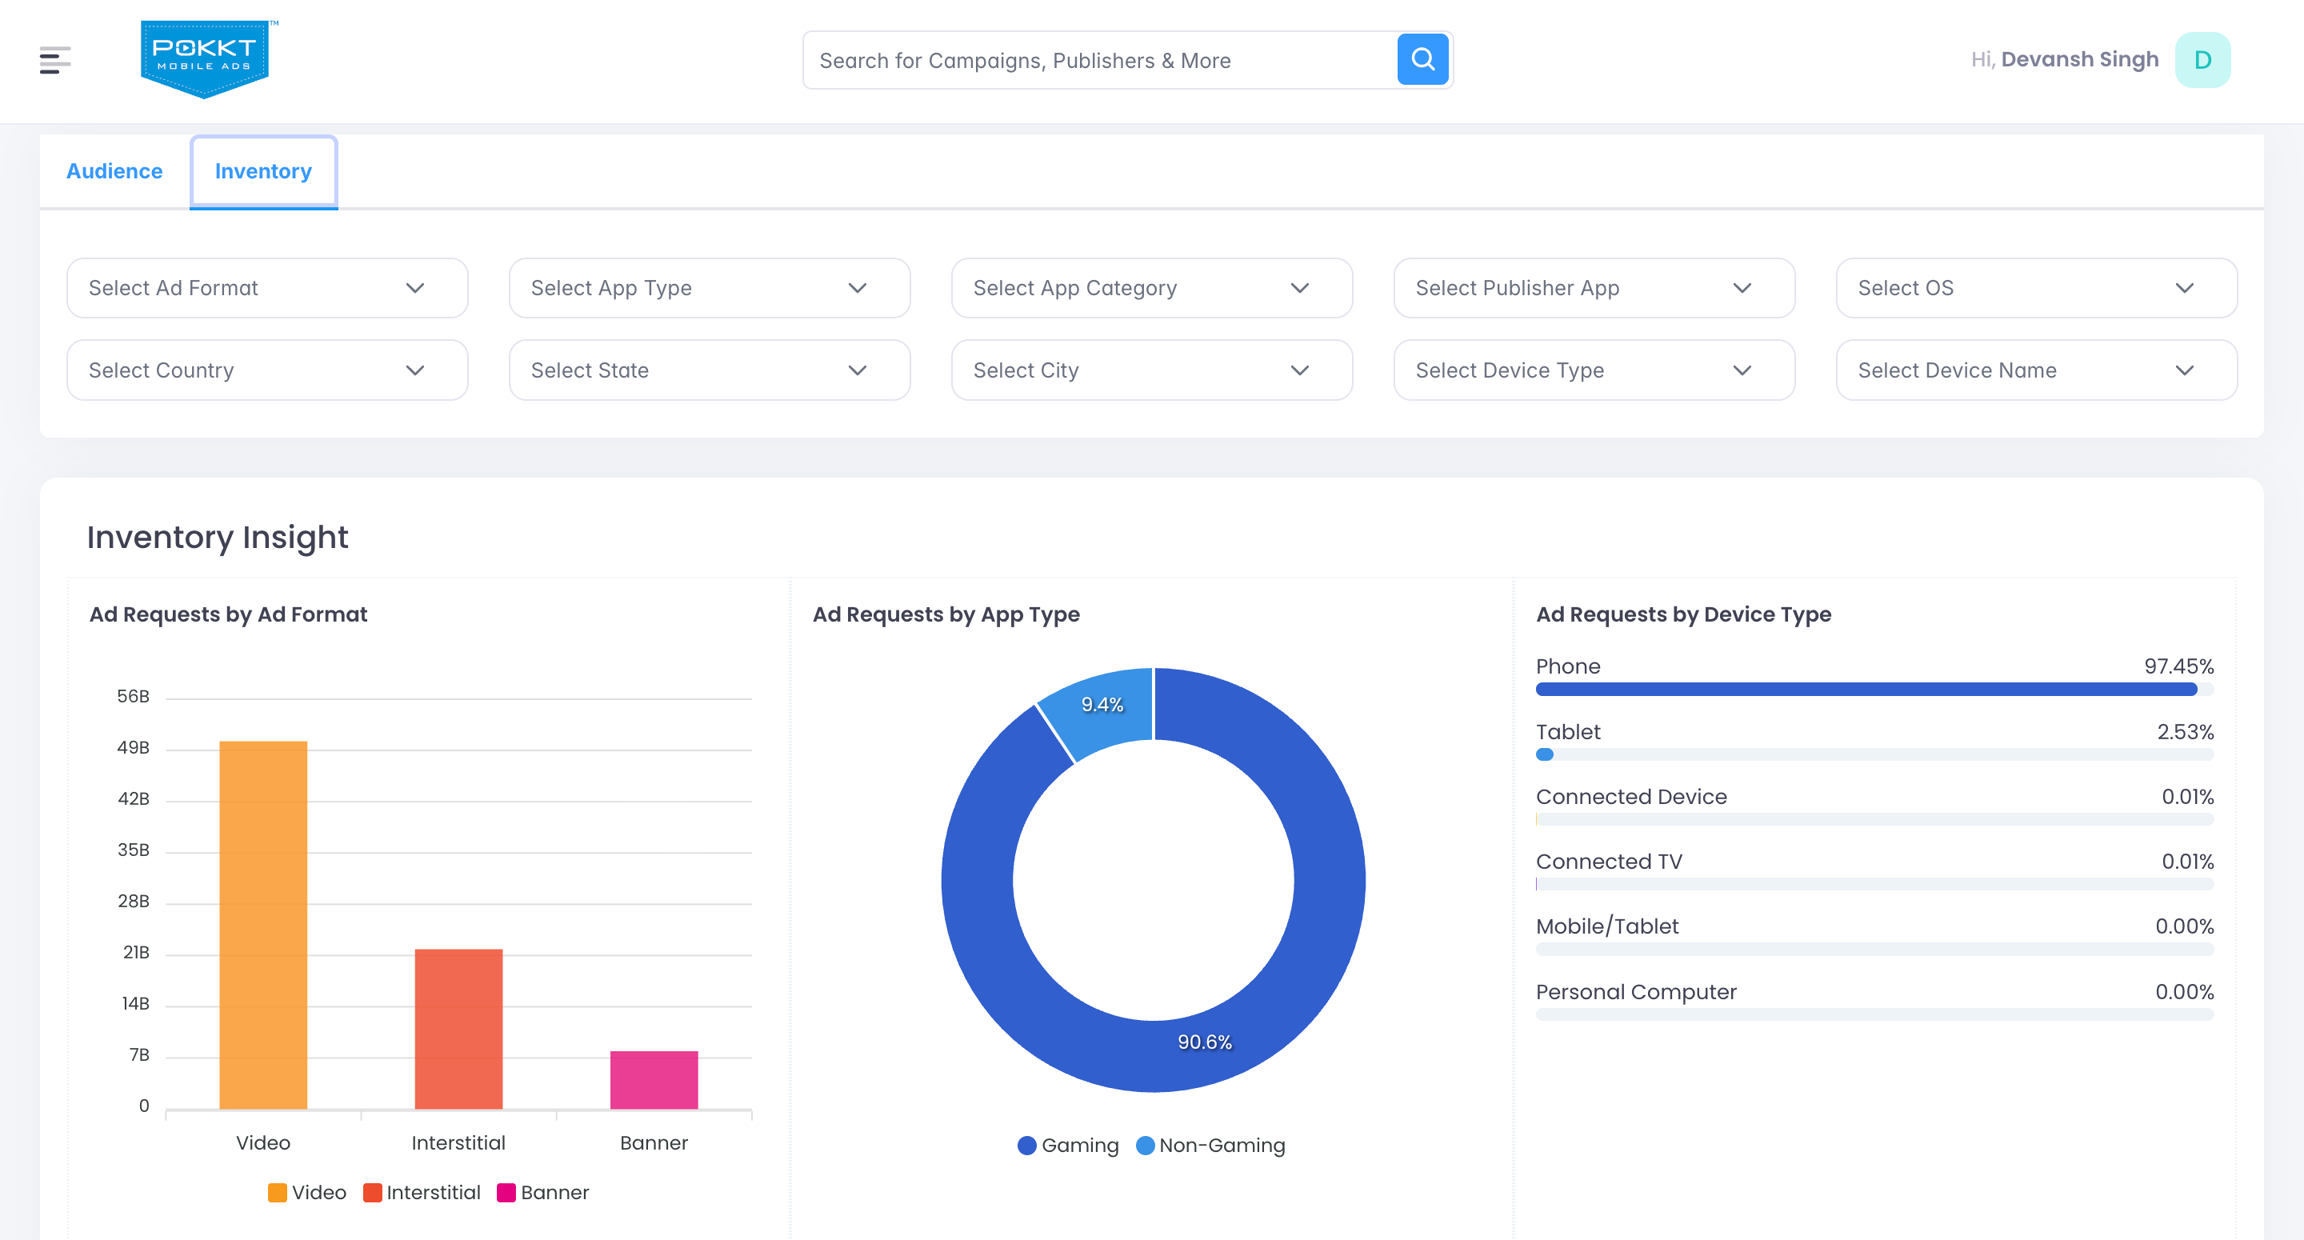
Use filters at the top of the page to narrow down your audience and inventory view. Filters are multi-select and remain persistent during your session.
Audience Filters
-
Country
Inventory Filters
-
Ad Format (e.g., Banner, Video, Interstitial)
-
App Type
-
App Category
-
Publisher App
-
Operating System
-
Country
-
State
-
City
-
Device Type
-
Device Name
After selecting your filters, a loading indicator is shown while data is fetched.
-
Step 3: Review Audience Insights
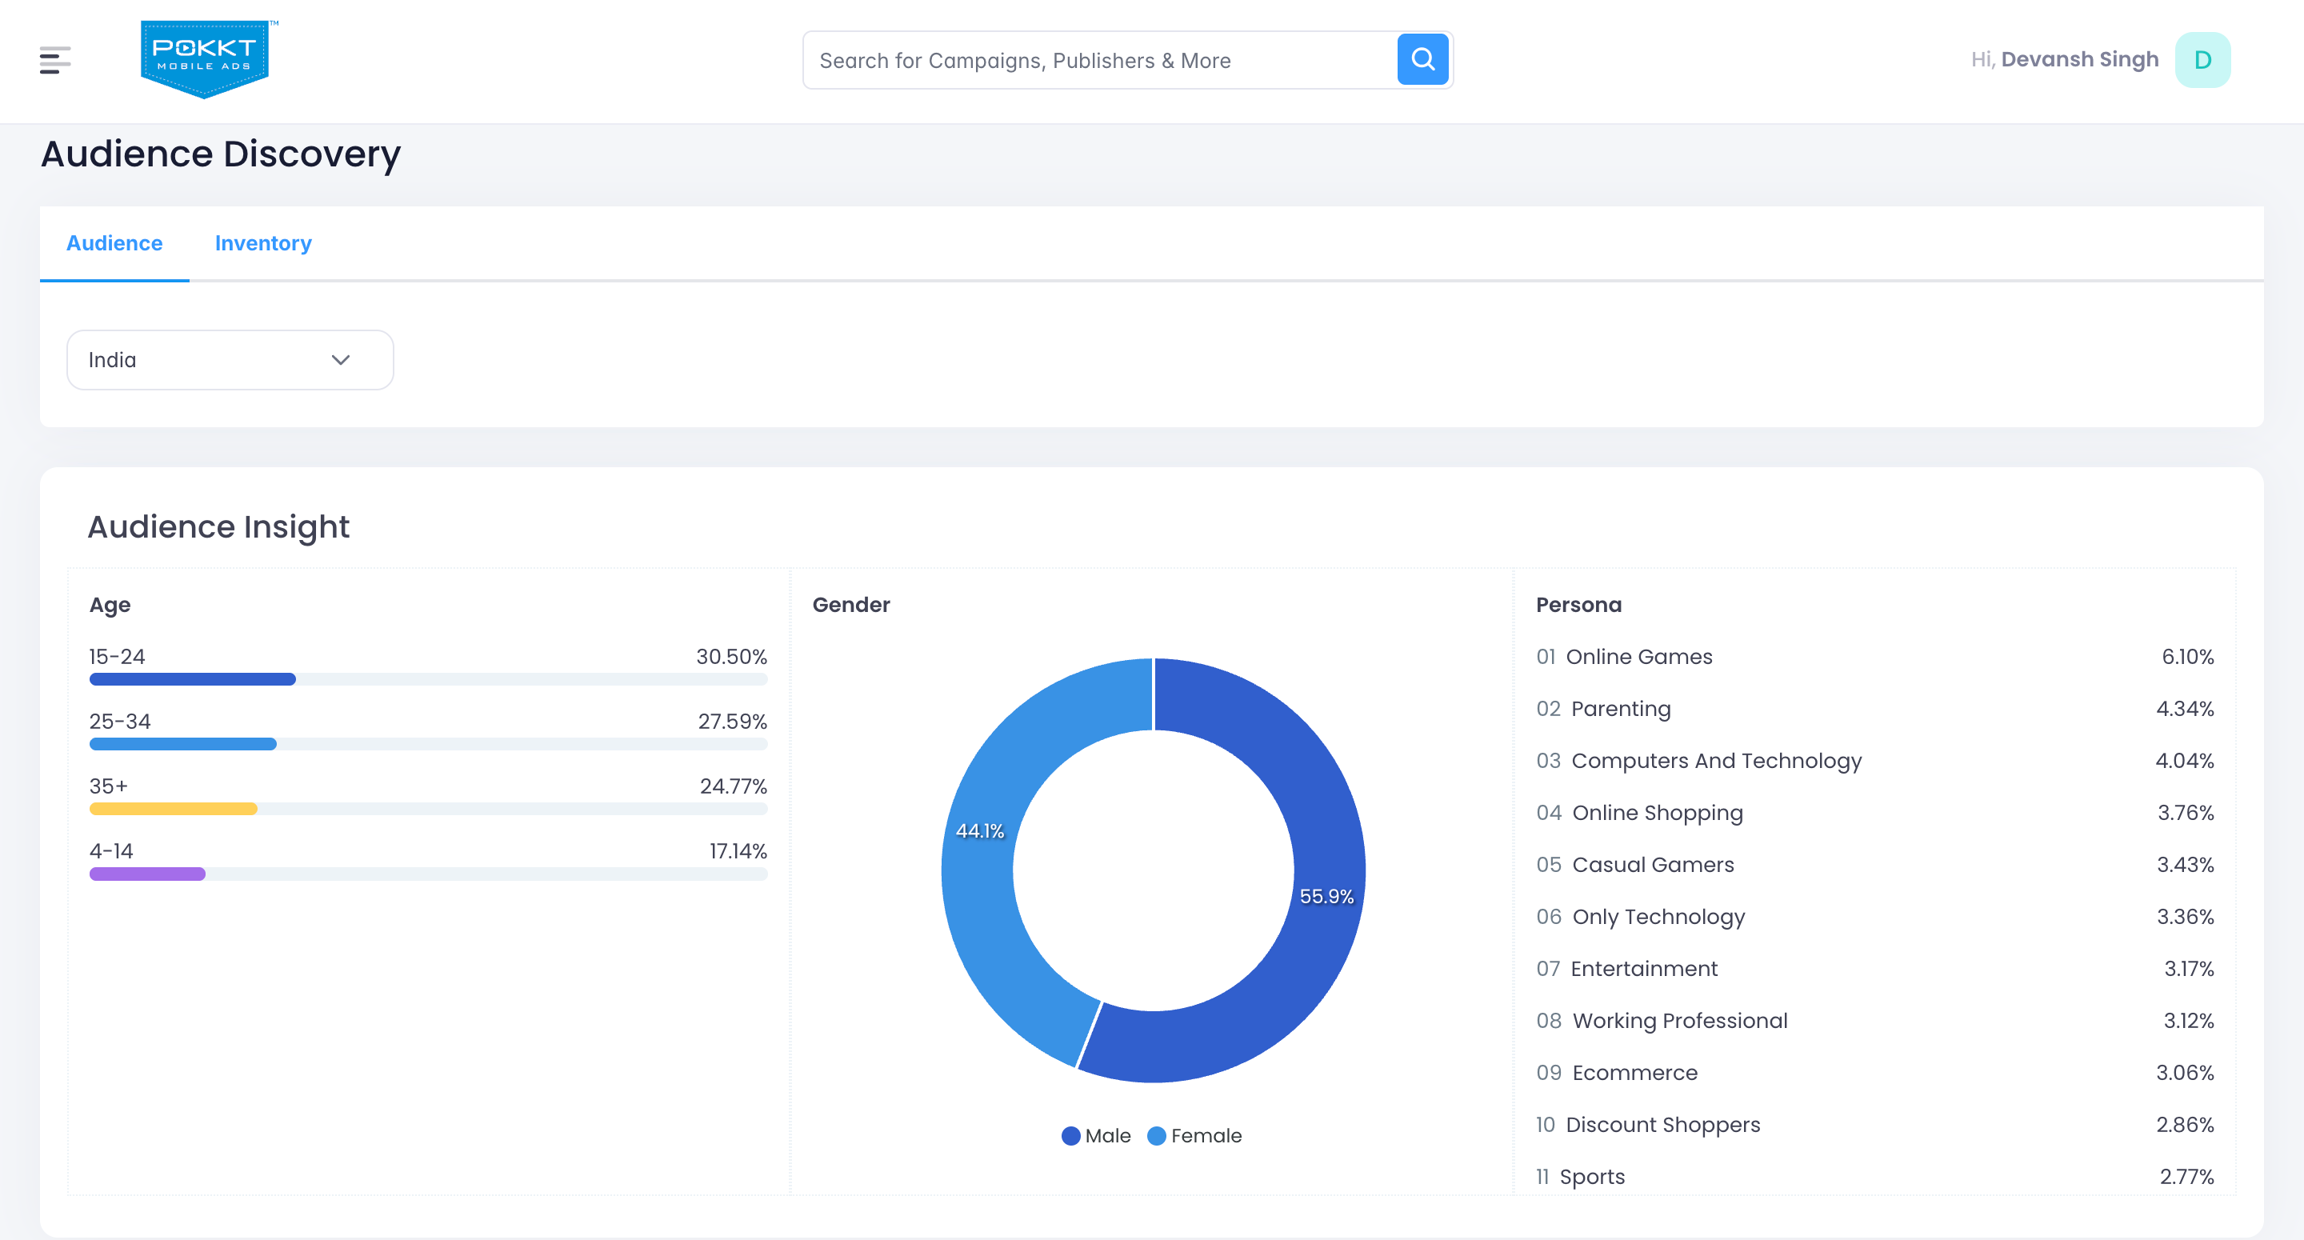
This section provides a high-level view of audience reach based on your selected filters. Available Audience Insights
-
Audience Reach by Gender Visualised as a Pie Chart to show percentage distribution.
-
Audience Reach by Age Displayed as a Bar Chart across age buckets for easy comparison.
-
Audience Reach by Persona Displayed as a Table to show percentage distribution.
These charts help quickly validate whether a target audience is large enough for a potential campaign.
Step 4: Review Inventory Insights
This section highlights available supply and scale for the selected filters.
Available Inventory Insights
-
Ad Requests by Ad Format
-
Ad Requests by Device Type
-
Ad Requests by App Type
All insights are dynamically updated based on the applied filters and help assess feasibility and scale for different campaign setups.
Step 5: Dive into Detailed Data
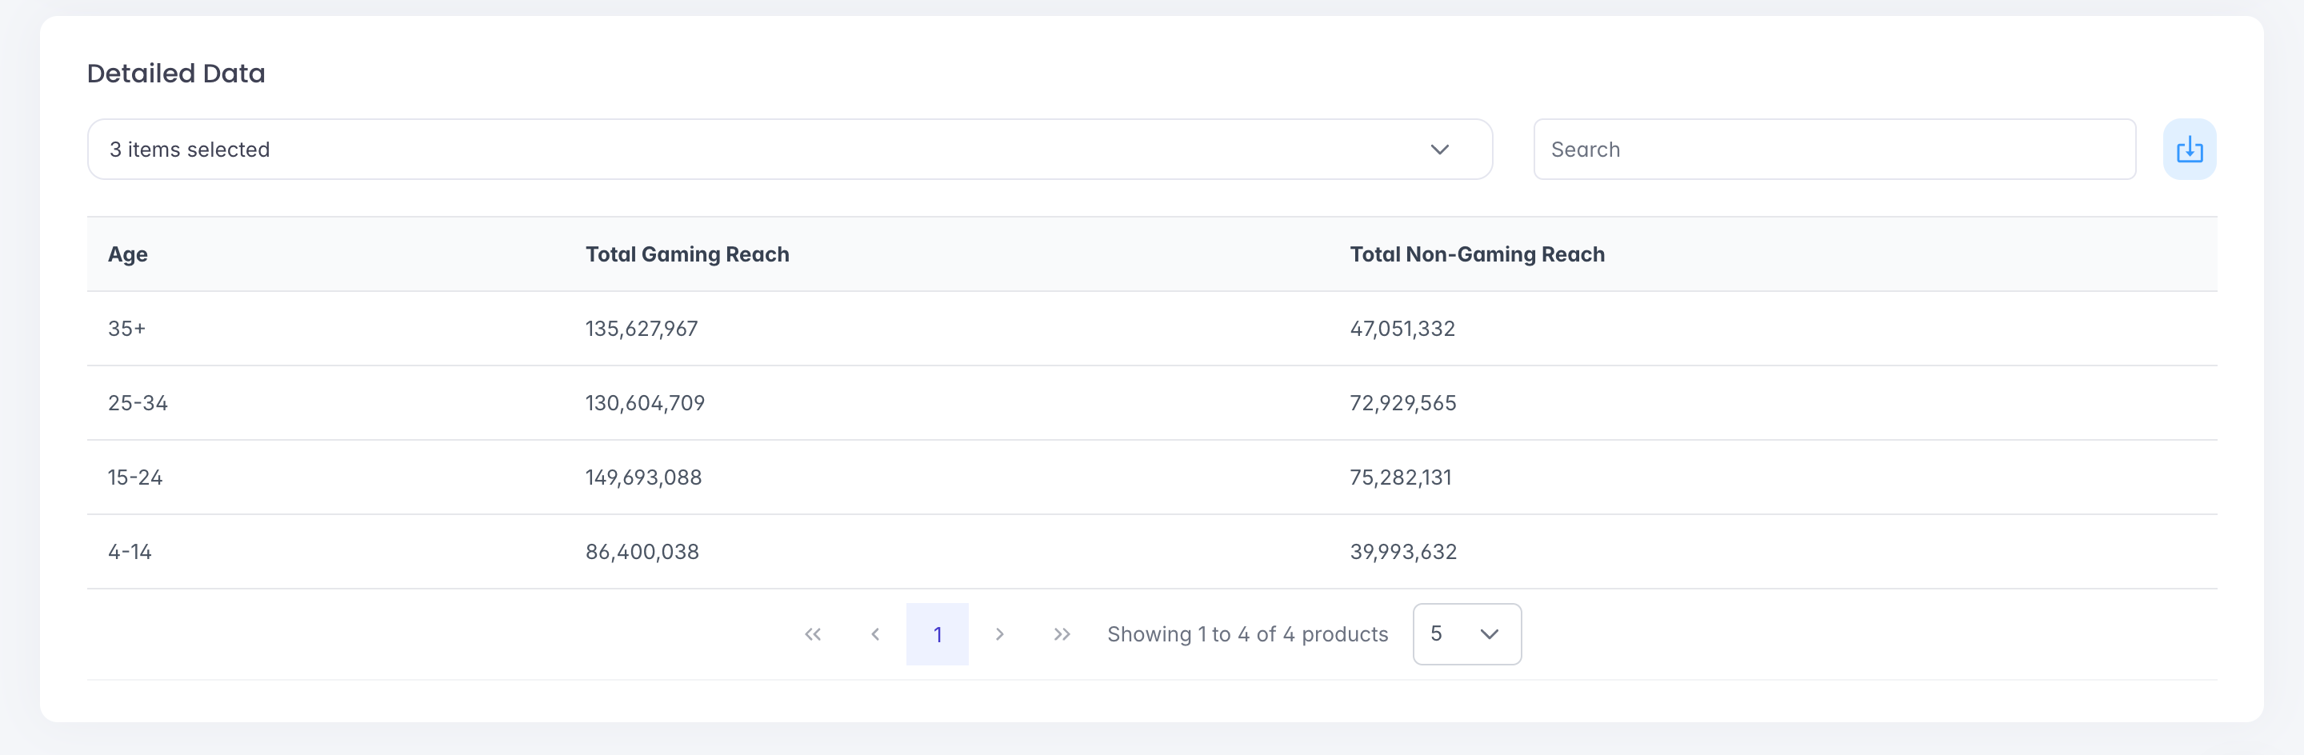
Scroll down to access the Detailed Data Table, which combines both audience and inventory data.
Audience Data Columns
-
Country
-
Gender
-
Age
-
Total Gaming Reach
-
Total Non-Gaming Reach
Inventory Data Columns
-
Ad Format
-
App Type
-
App Category
-
App Bundle ID
-
OS Type
-
Country, State, City
-
Device Brand
-
Device Model
-
App Name
-
Monthly Unique Users
-
Average Bid Floor
-
Monthly Ad Requests
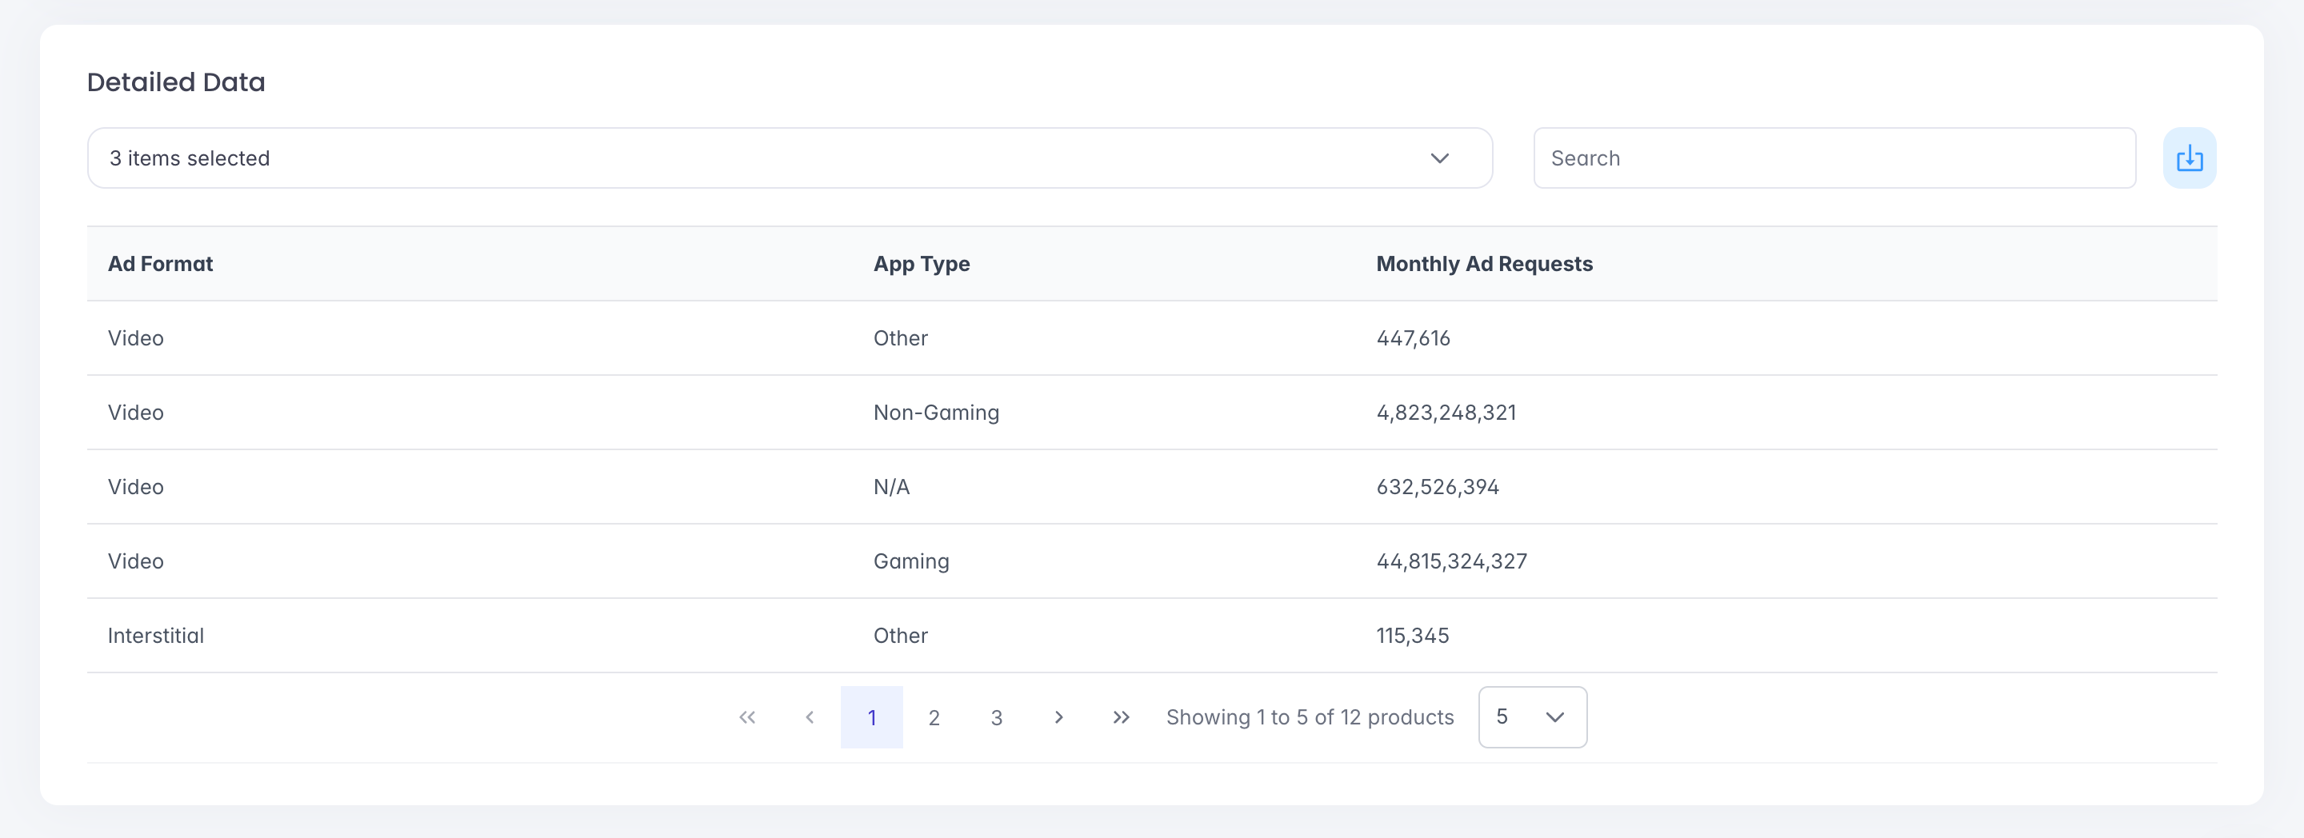
Table Features
-
Search bar to find specific apps, devices, or ad format
-
Responsive layout for large datasets
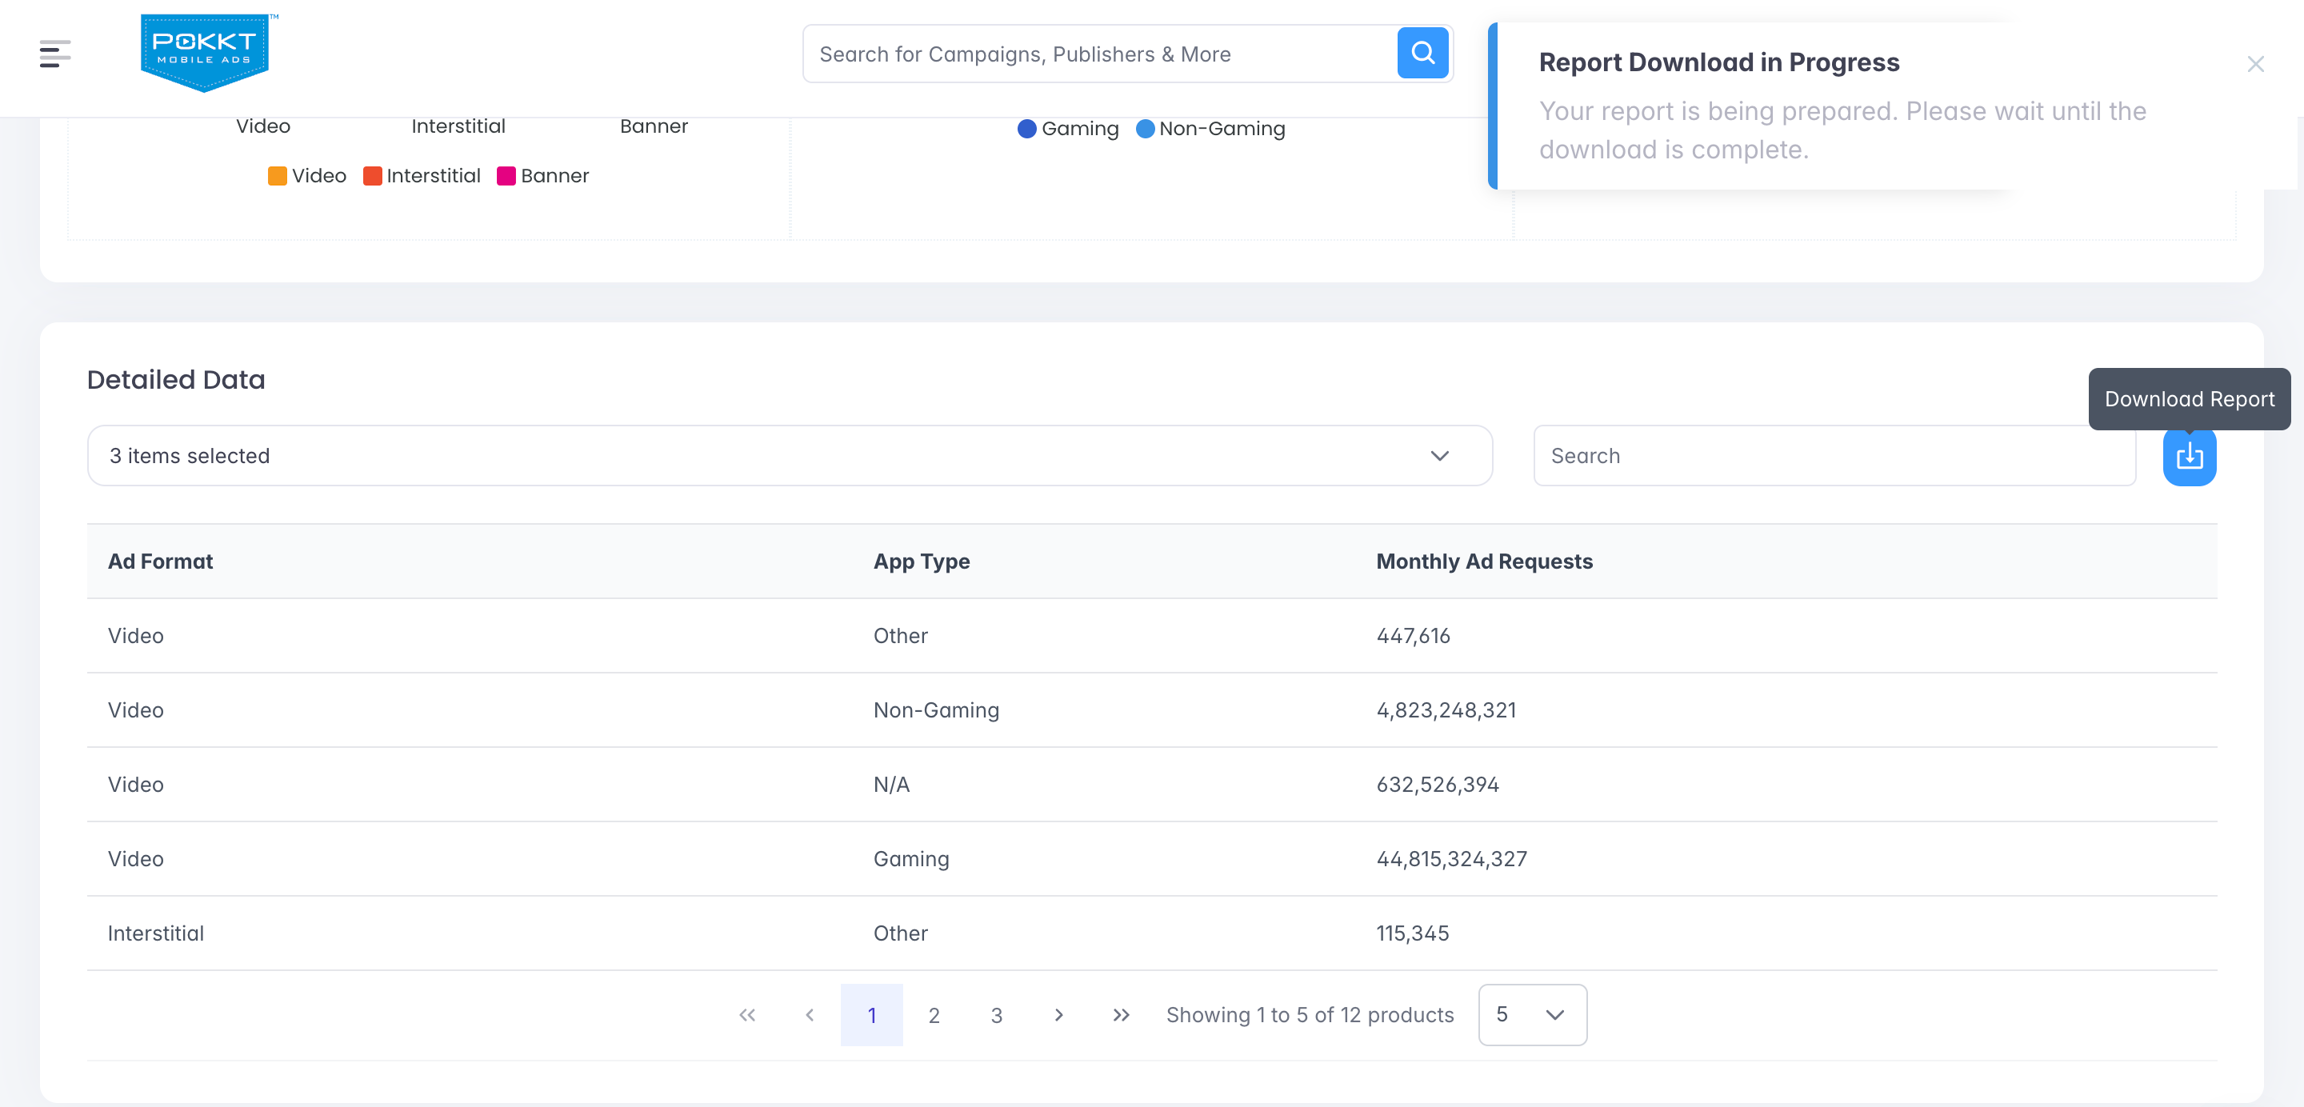
Step 6: Export Data
-
Click the Download button above the table
-
The system generates a CSV file based on the currently applied filters
FAQs
-
Is this data real-time? No. The dashboard uses aggregated and processed data every month, optimised for fast and reliable output.
-
What time range does “Monthly” data represent? “Monthly” metrics represent average monthly volumes derived from recent historical data, not a fixed calendar month unless explicitly stated.
-
Can I use multiple filters at once? Yes, All filters are multi-select and can be combined to create highly specific views. Be mindful that applying too many filters may reduce available data.
-
What happens if no data is returned?
If your selected filters are too restrictive:
-
The dashboard will show a “No Data Found” message
-
Adjust filters to broaden the criteria
The new targeting rules take effect immediately after saving.
-